
Once an episode is published to Mato Distribution, its Analytics tab shows how it is performing: downloads over time, how it compares to the rest of the show, and where its listeners come from.
This guide covers what each part of the tab shows and when the data is available.
Before analytics is available
Mato can only report analytics for episodes it has published. If the episode has not been published yet, the tab shows "Analytics not available yet" with a link to open publishing settings.
If the episode is published but Mato has not aggregated any data for it (for example, it published very recently), the tab shows "No analytics data yet" instead, with a link to the show's overall analytics. Mato aggregates analytics once a day at 2:00 AM UTC, so a newly published episode's numbers show up after the next aggregation window, not immediately.
Choose a period
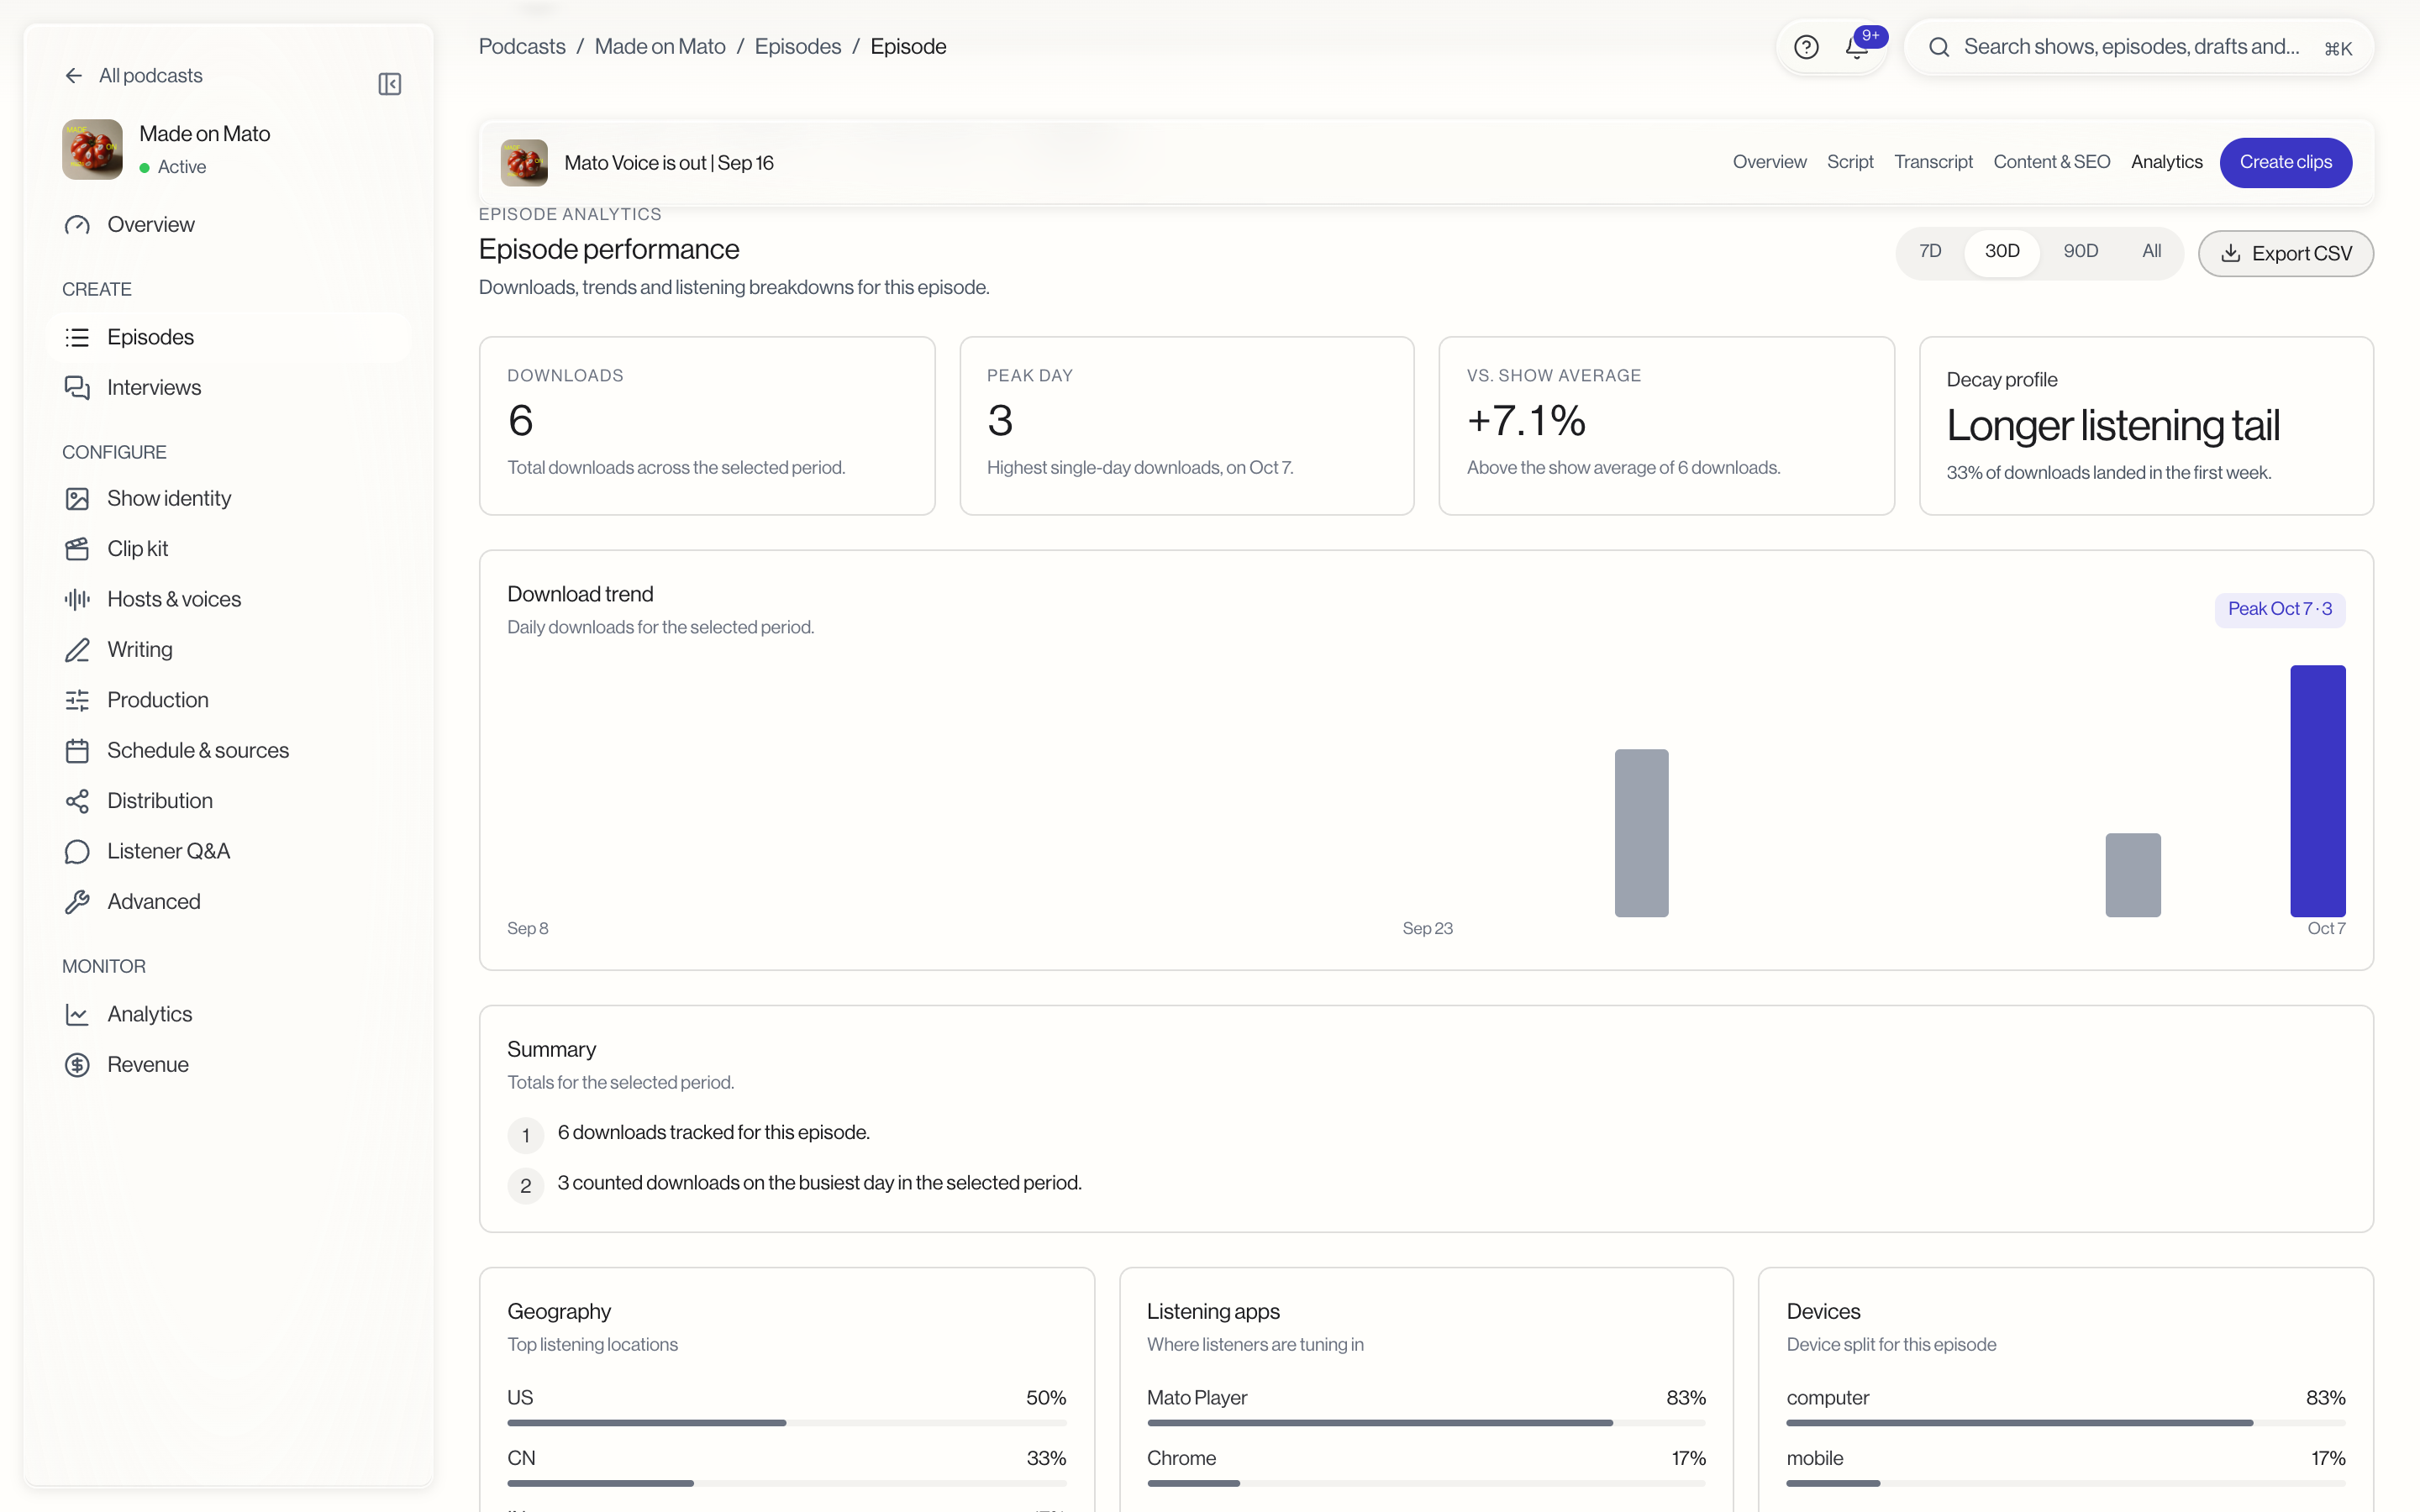
Use the period control to switch between 7D, 30D, 90D, and All. The default is 30 days. Click Export CSV to download the currently selected period's daily download counts as a CSV file.
Read the numbers
Four cards summarize the period:
- Downloads: total downloads across the selected period.
- Peak day: the single highest-download day in the period, and its date.
- Vs. show average: how this episode's downloads compare to the show's average, shown only when the show has enough other episodes to compare against.
- Decay profile: a plain-language read on the shape of the download curve, such as "Heavy first-week spike" or "Longer listening tail," based on how much of the total landed in the first week.
Below the cards, the Download trend bar chart shows downloads per day, with the peak day highlighted. A Summary card next to it restates the episode's total and its busiest day; it is a summary of the numbers already on the page, not a separate analysis.
Breakdowns
Three ranked lists show where downloads come from: Geography (country, and region when available), Listening apps, and Devices. A note under them reads "Updated daily at 2:00 AM UTC." Each list shows up to five entries with everything past that folded into an "Other" row. These breakdowns are based on the top entries Mato tracks per episode, so a very long tail of small values may not be fully represented in "Other."
Below the breakdowns, a CTA performance card counts clicks from this episode on your tracked call-to-action links. Only clicks that kept this episode's attribution show here; other CTA clicks stay in show analytics. If you have not set up a tracked link, it reads "No CTA links configured" with an Open classic settings button, since tracked CTA links are added in the classic Distribution settings.
Related articles
- Publish an episode covers publishing to Mato, which analytics depends on.
- Episode detail covers the rest of the episode page.