
Every show has an Analytics section with four tabs: Overview, Episodes, Audience, and Links. They all read from the same downloads data and share one period control, so a number you see on Overview always matches the same window on Episodes or Links.
This article covers what each tab shows and how to read it. For ad income, see Revenue. For how Mato defines a download and how often the numbers update, see Distribution analytics.
Where to find it
Open a show, then click Analytics under Monitor in the left sidebar. The four tabs sit under the page title: Overview, Episodes, Audience, Links.
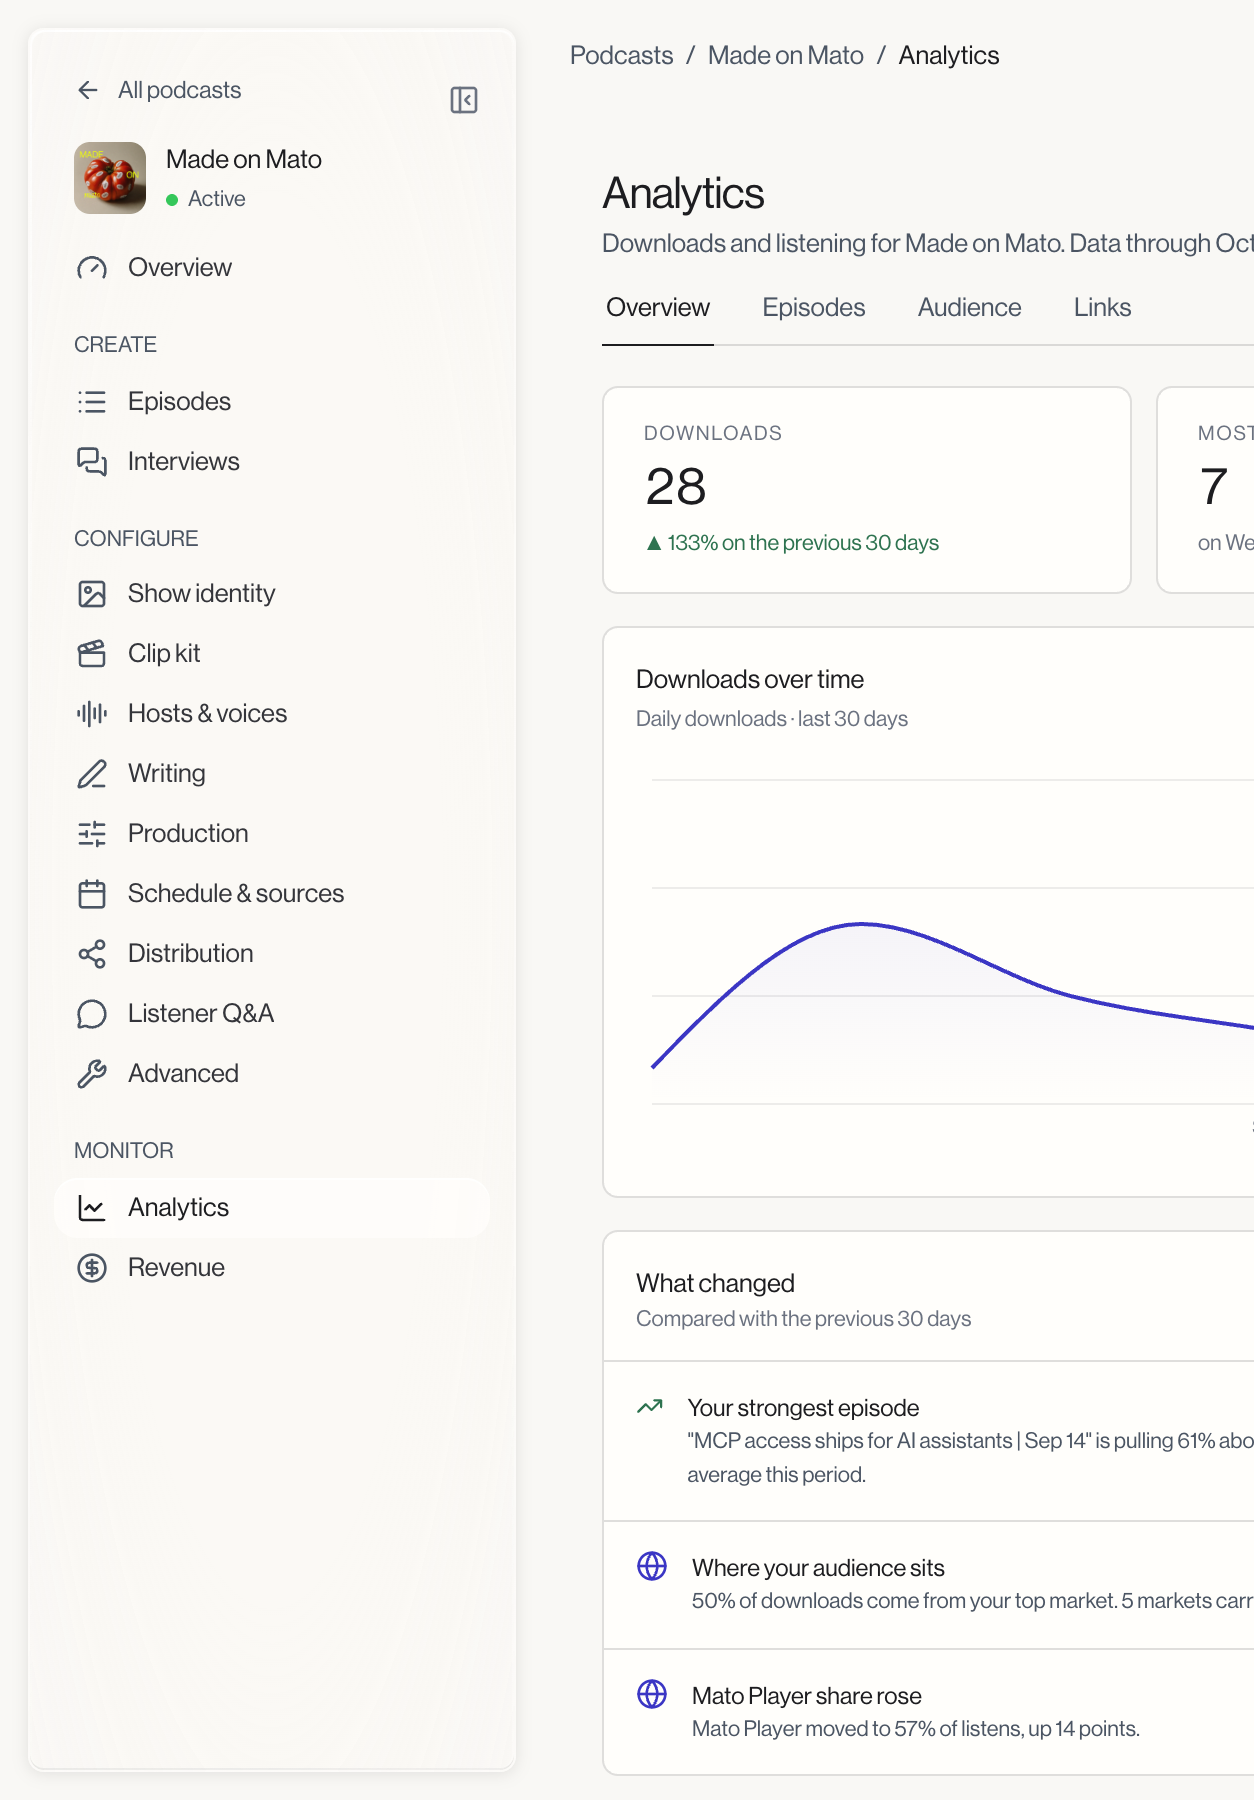
Analytics only works for a show connected to Mato Distribution. If it is not connected yet, every tab shows "Analytics start once Mato hosts this show" instead of numbers, with a link to publishing settings. If the show is connected but has no listens yet, the tabs show "No listens yet" instead.
Period
A period control sits at the top right of every tab: 7D, 30D, 90D, or All. Changing it updates all four tabs, and the choice follows you to Revenue and to each episode's own Analytics tab. There is no separate day/week/month grouping control: Mato picks daily buckets for 7D, 30D, and 90D, and weekly buckets for All.
Export CSV
Next to the period control, Export CSV downloads the data behind the tab you are on. Overview, Episodes, Audience, and Links each export their own file (for example analytics-overview-<podcastId>-<period>.csv). The button is disabled while the show is not connected to Mato Distribution.
Overview
Four numbers sit across the top:
- Downloads: the total for the selected period.
- Most listeners in a day: the highest single-day count in the period, with the date it happened.
- Episodes with downloads: how many episodes got at least one download, out of how many are published.
- Apple Podcasts: the show's current position on the Apple Podcasts chart, when Mato has a reading, with the move since the last reading (for example "Up 3 places since the last reading").
Below the numbers, a downloads-over-time chart plots the period. The chart's own subtitle tells you the bucket size: "Daily downloads · last 7 days" for 7D/30D/90D, "Weekly downloads · all time" for All.
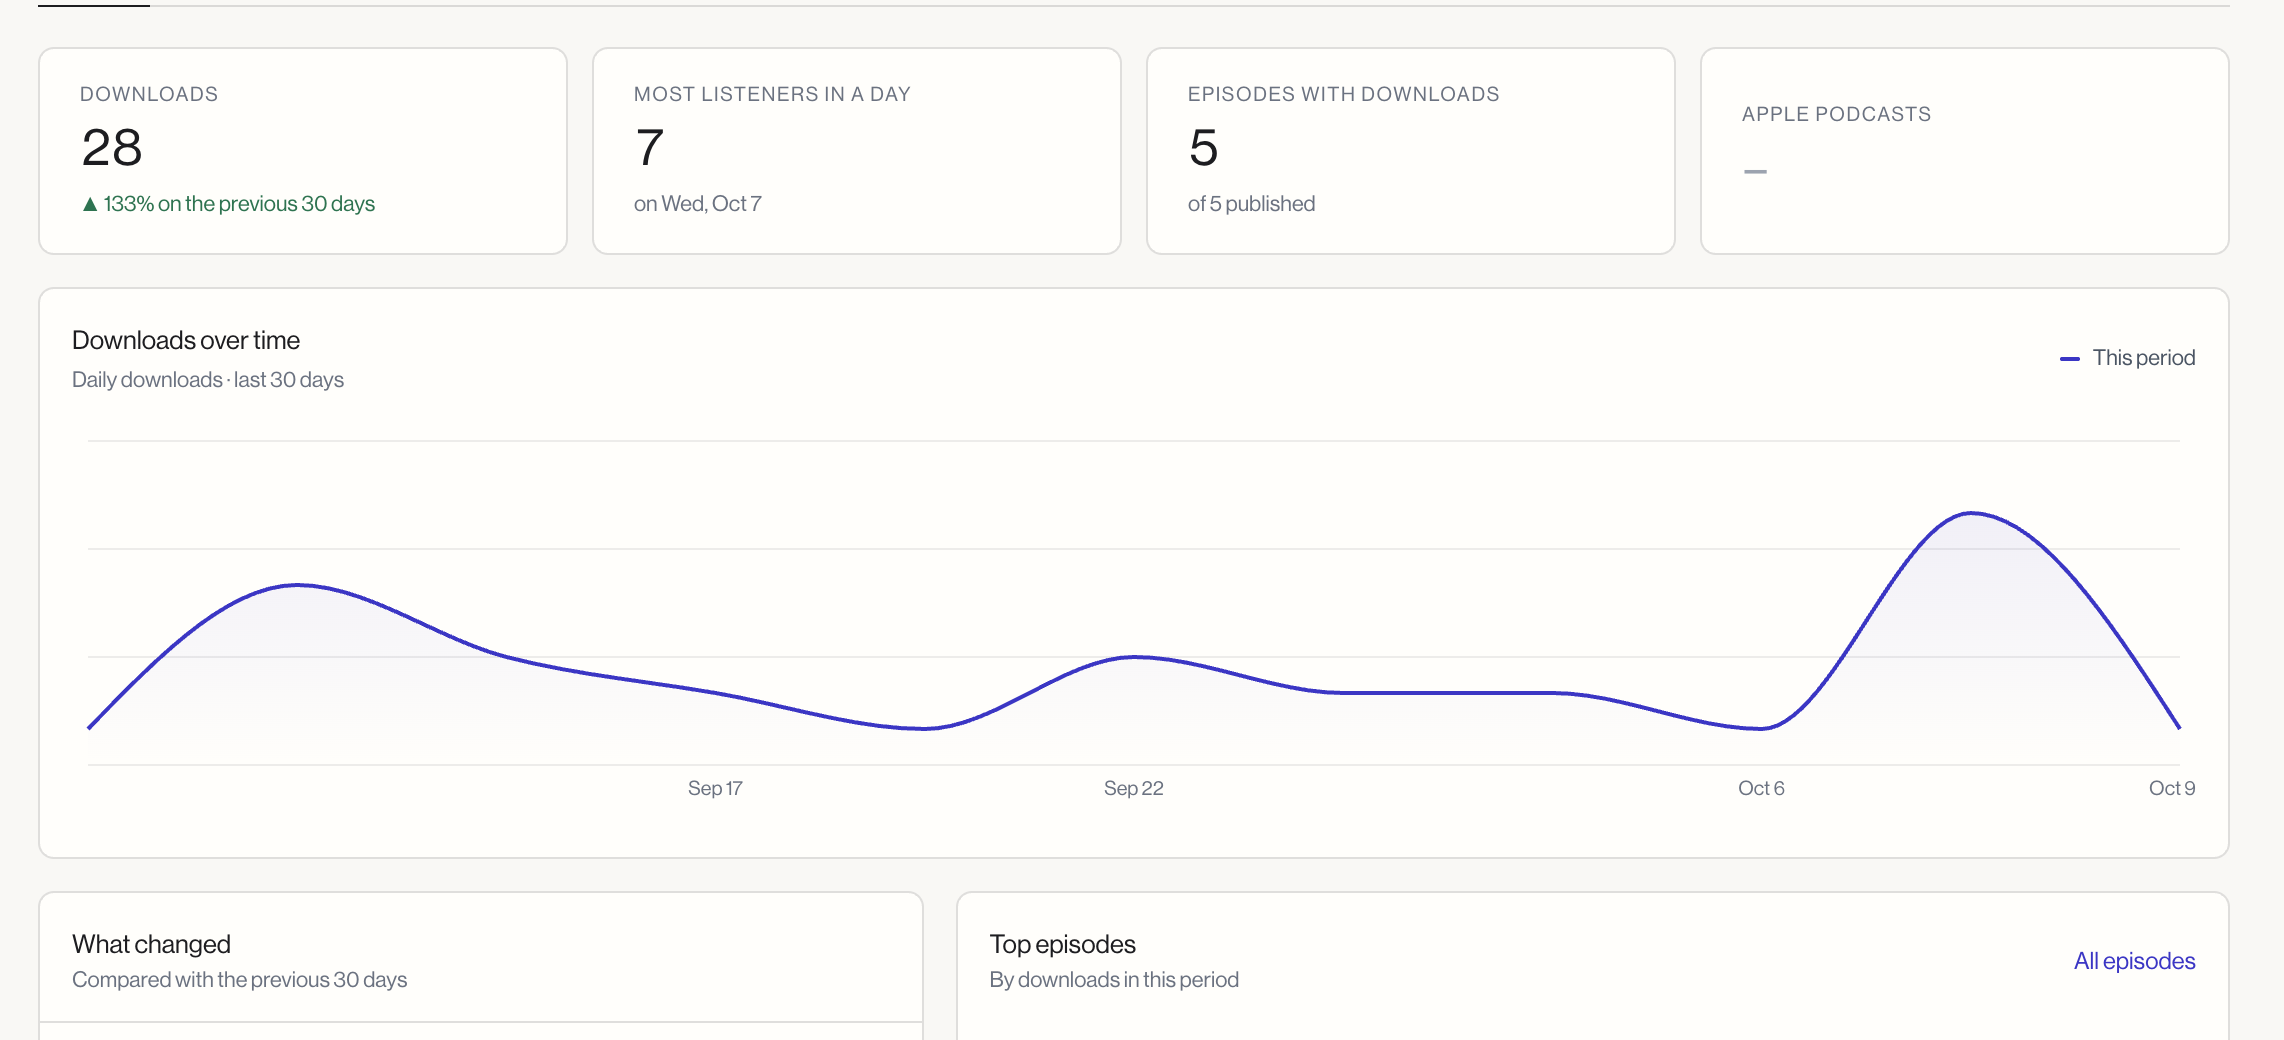
Two panels sit side by side under the chart:
- What changed highlights specific movements Mato noticed in the period (a standout episode, an Apple Podcasts chart move, an app gaining or losing share). If nothing stood out, it says so.
- Top episodes lists the four best-performing episodes by downloads in the period, each linking to that episode's own Analytics tab.
A Next milestone card below both panels tracks progress toward a round download number for the period (for example "Next milestone: 5,000 downloads in 30 days"), with a count of how many downloads are left.
Episodes
The Episodes tab is a single sortable table of every episode with downloads in the period: episode, published date, downloads, and share of the period's total downloads. This is the full list; Overview's Top episodes panel only shows the top four.
Audience
Three panels sit across the top: Countries, Listening apps, and Devices, each ranking the top entries by downloads in the period. Below them, New countries lists any country that generated its first download in the period, and an Apple chart history table lists the show's chart position by date (up to 30 entries).
Links
The Links tab tracks clicks on the tracked links in your show notes, show description, and public pages (the same links you manage under Settings › Distribution). If no links are tracked yet, the tab shows "No links set up yet" with a shortcut into Distribution settings instead of the usual layout.
Once links exist, three numbers lead the tab: total clicks, clicks per 100 downloads, and the number of tracked links. Below them, a clicks-over-time chart, a table of every link with its destination and click count, and two panels showing where clicks came from (episode descriptions, the show description, your funding entry, Mato's public pages, or elsewhere) and which episodes drove the most clicks.
Related
- Revenue: ad income from the same show, on the same period control.
- Distribution analytics: what counts as a download and when the numbers update.
- Episode analytics: the same breakdown scoped to one episode.